 Claw
Claw
Your agent ran for forty minutes and spent real money. It called tools, spawned sub-agents, read memory, hit a rate limit, retried. Then it said “Done!”
Done what, exactly?
That question is the whole reason ClawMetry exists. This post walks through how it answers it — across OpenClaw, Claude Code, Codex, Cursor, Hermes, Antigravity and the rest of the 26+ runtimes it watches — without you changing a single line of your agent.
Agents are executing in the dark
Every agent framework is generous with logs while it runs and useless the moment it stops. You get a wall of scrollback, no totals, no history, and no answer to the three questions that actually matter: what did it do, what did it cost, and is it stuck right now?
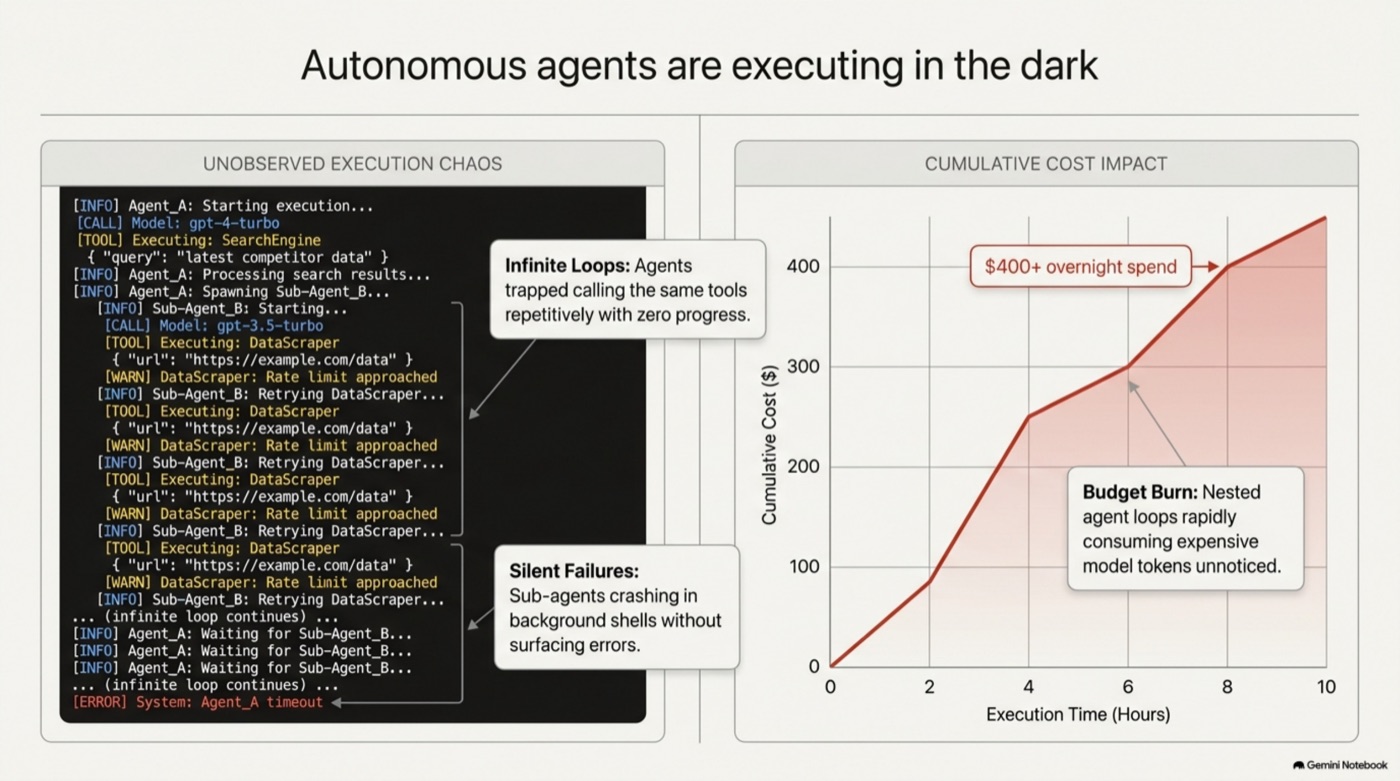
The failure modes are not exotic. An agent gets into a retry loop and calls the same tool two hundred times with zero progress. A sub-agent crashes in a background shell and never surfaces the error, so the parent happily reports success. A nested loop quietly consumes expensive model tokens overnight, and you find out when the invoice does.
None of these announce themselves. They all show up in data the agent is already writing — which is the opening.
Thirty seconds from chaos to mission control
The usual fix for observability is to instrument your agent: wrap the SDK, register a callback, ship spans. That works right up until you run a second framework, and now you maintain two integrations that drift apart.
ClawMetry takes the other road. There is no SDK to import and no code to change:
pip install clawmetry && clawmetry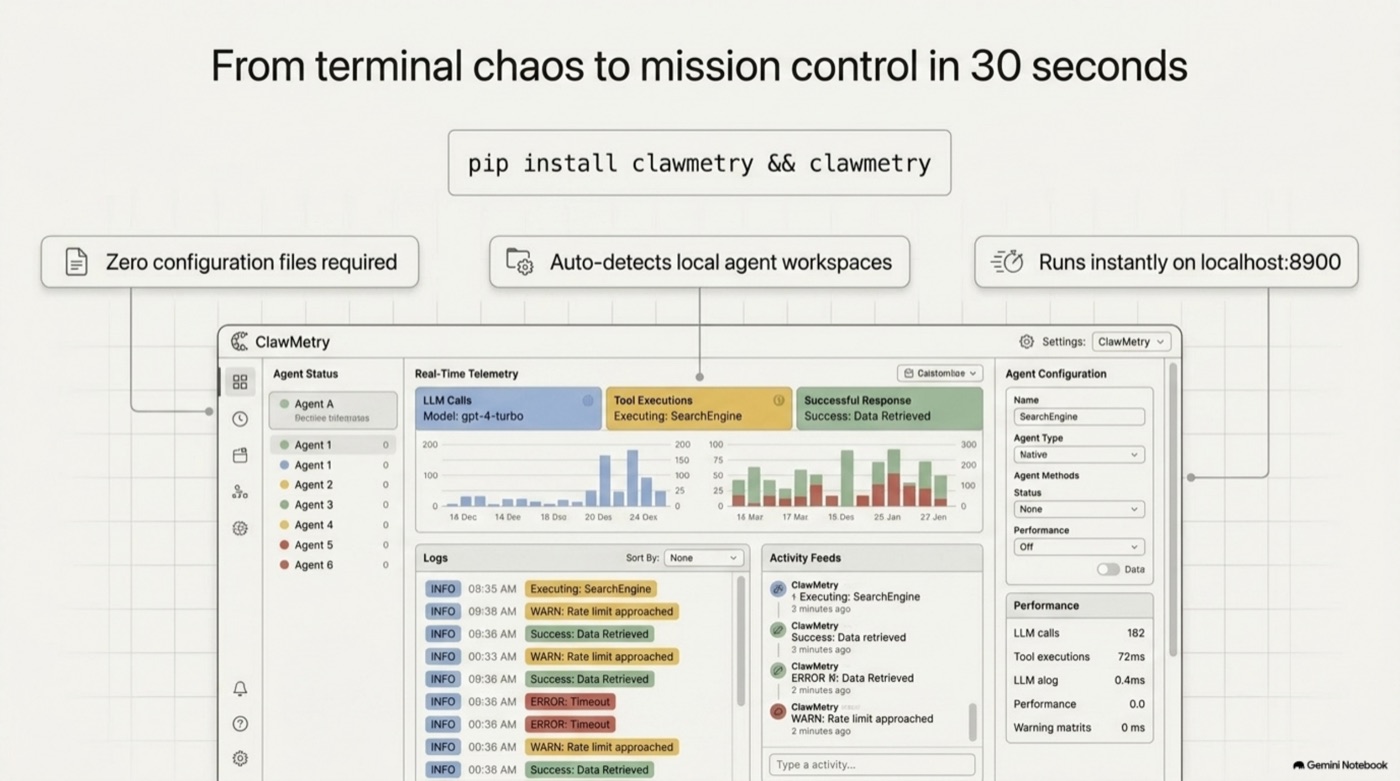
On launch it finds your workspace, the gateway port, the auth token and the log directory on its own. If your agent is running, it gets found.
One dashboard for twenty-six fragmented frameworks
Most teams do not run one agent framework. They run Claude Code in the terminal, something Codex-shaped in CI, Cursor in the editor, and a long-lived OpenClaw gateway holding it all together. Each has its own idea of what a session is and where it belongs.
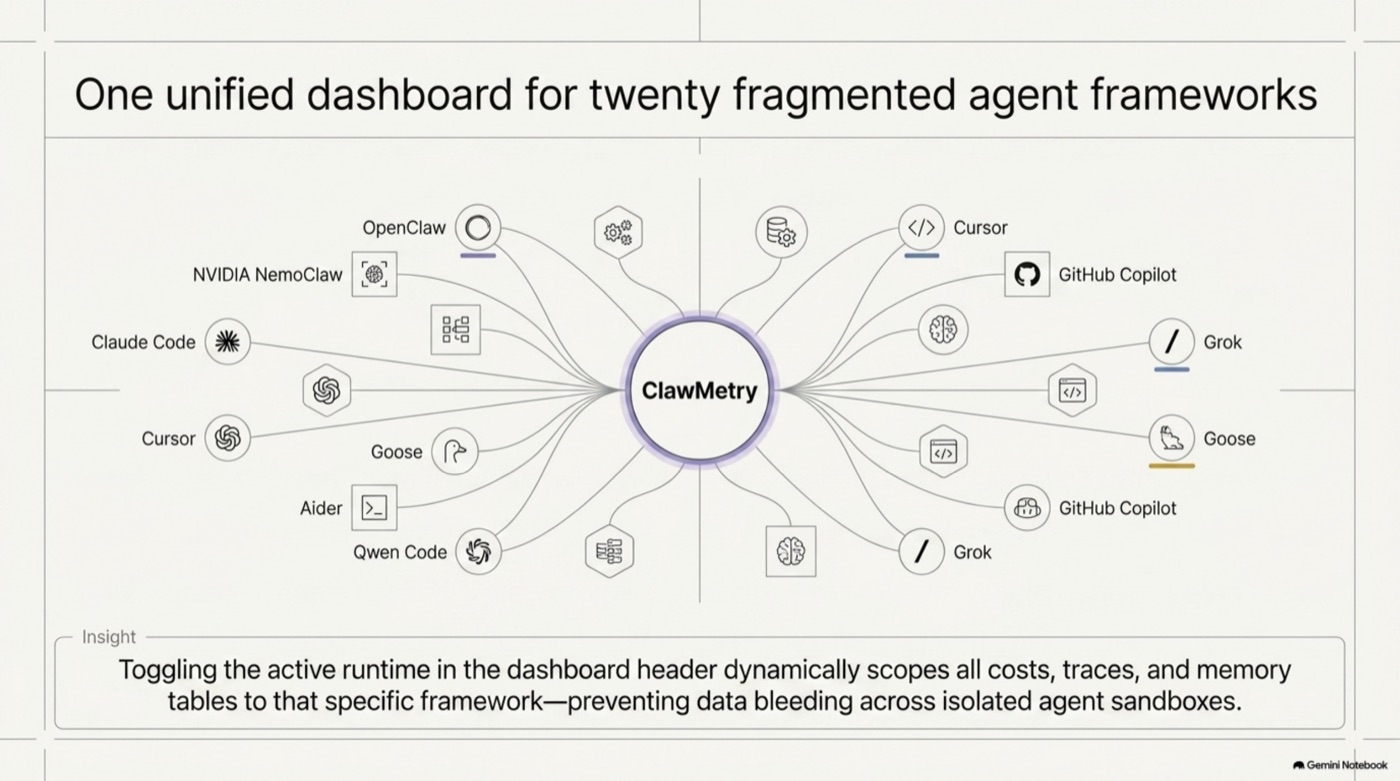
Because ClawMetry reads what each runtime already produces rather than asking it to cooperate, adding the next runtime costs us an adapter and costs you nothing at all.
A local-first pipeline, and your data stays put
Everything ClawMetry ingests lands in an embedded analytical database on your own machine. A background daemon does the parsing; every view in the product reads from that store rather than from raw files.
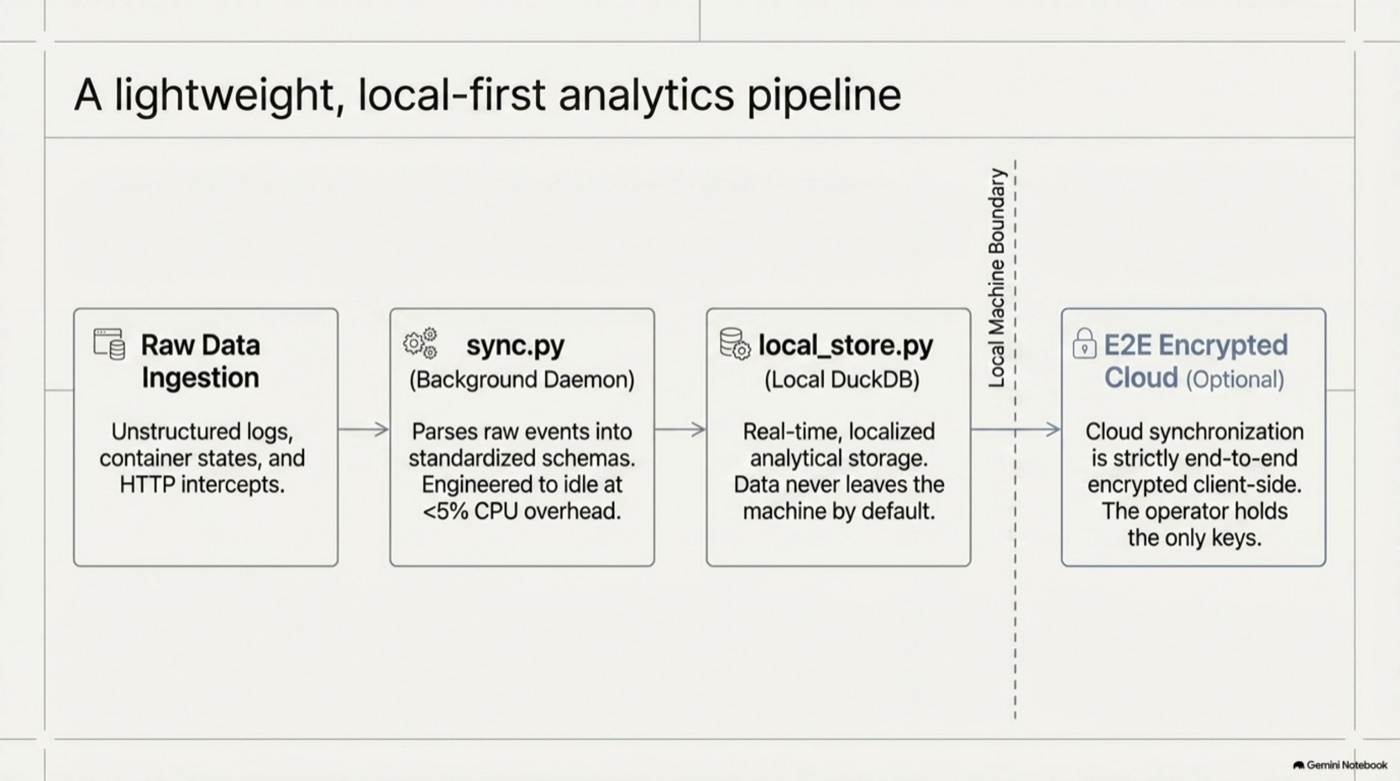
That indirection is what makes the numbers trustworthy. Cost is computed once, at ingest, with the provider and model attached — so the figure on the overview is the same figure on the session and the same figure in the export. One definition, everywhere.
Agent transcripts are among the most sensitive text on your disk: your source, your customers, and whatever you pasted in at 2am. So the default is local, and nothing is transmitted anywhere. If you switch on the optional cloud view, the daemon encrypts the snapshot before it leaves your machine and your browser holds the key. The server stores ciphertext it cannot read.
Exact attribution, not a monthly surprise
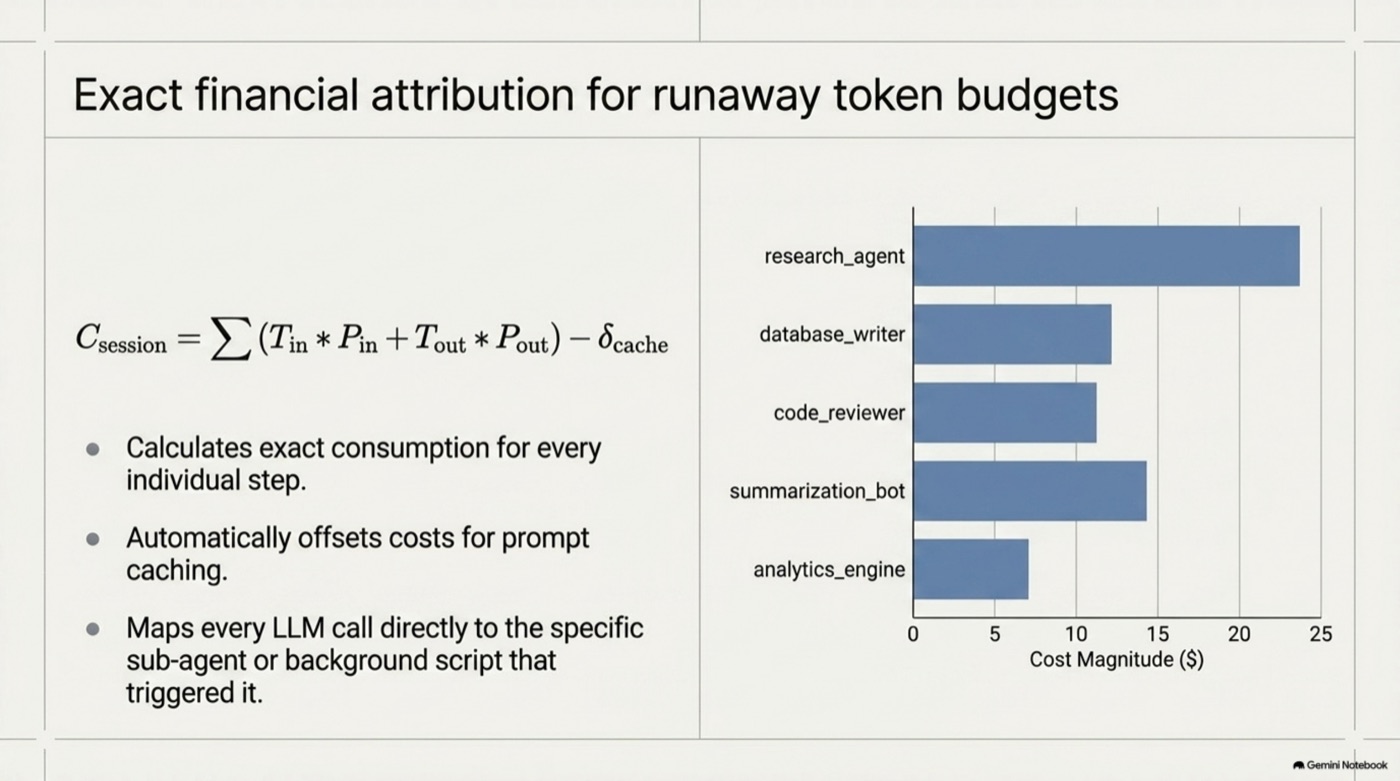
“We spent $4,000 on tokens last month” is not an insight. “The summarization bot's retry path spent $340 of it, on Tuesday” is.
Watching the cognitive path
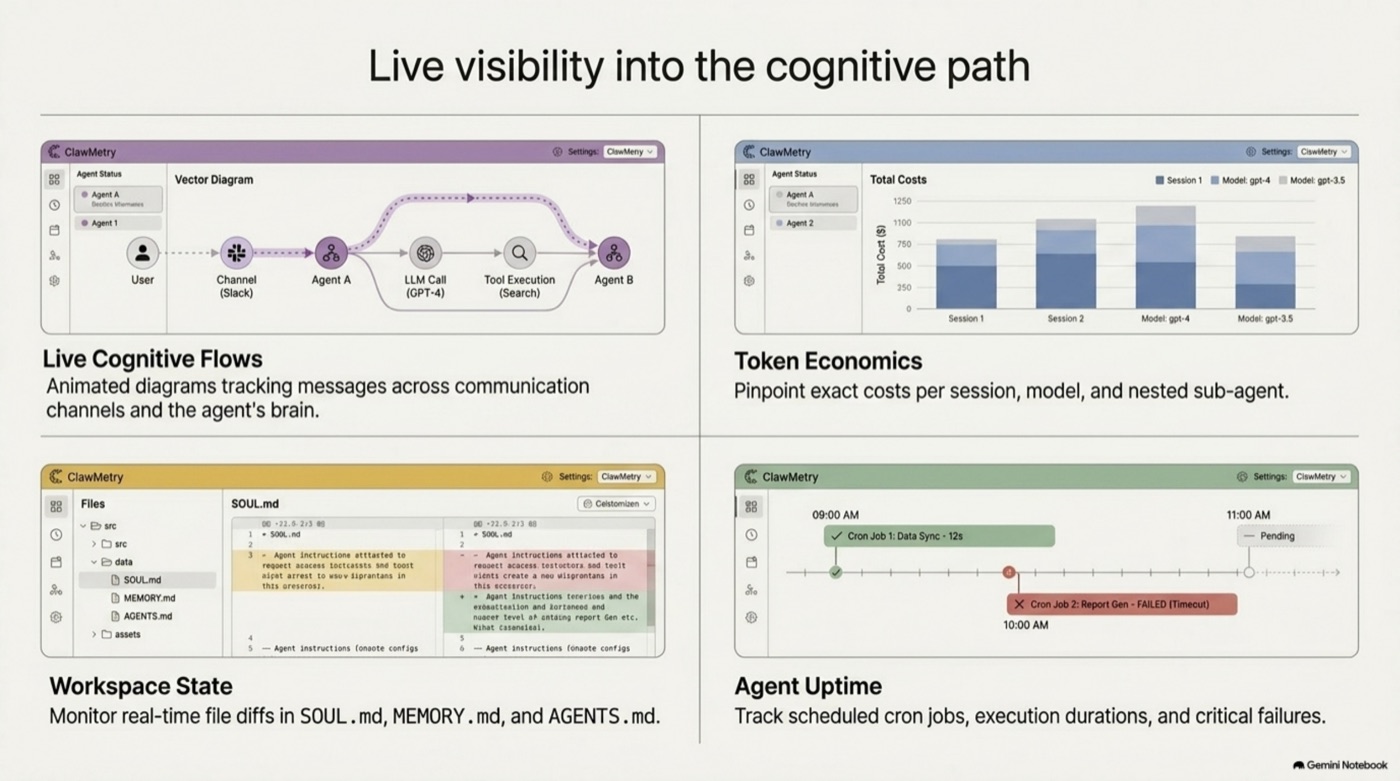
Totals tell you that something happened. The live view tells you what your agent is thinking right now — the reasoning, the tool calls, the memory reads, in the order they occur. This is the one people leave open on a second monitor.
When observing is not enough
Watching is the default and, for most people, the whole product. But once agents can run shell commands against real systems, some actions deserve a human in the loop before they happen rather than a good log afterwards.
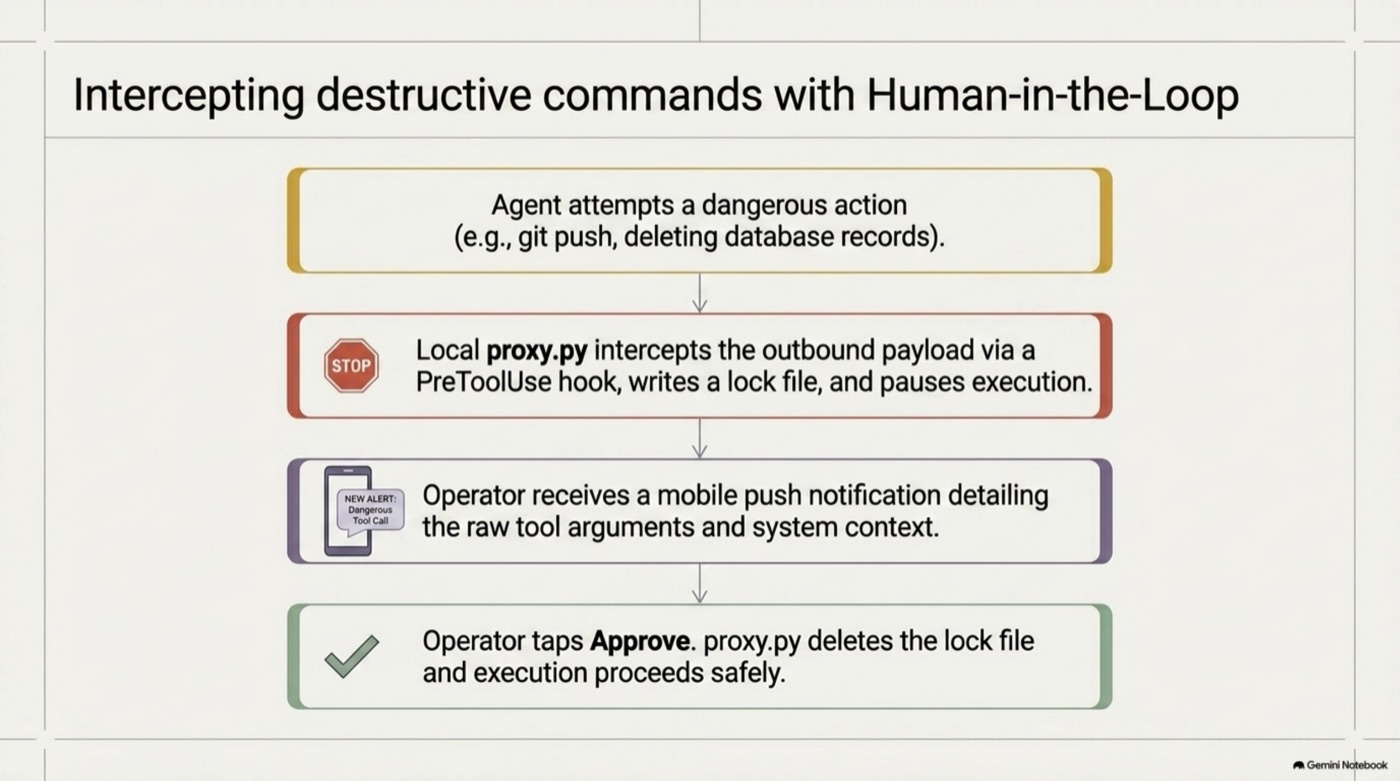
This is opt-in. ClawMetry observes by default and only sits in the path when you explicitly ask it to.
OpenTelemetry native, so nothing is trapped
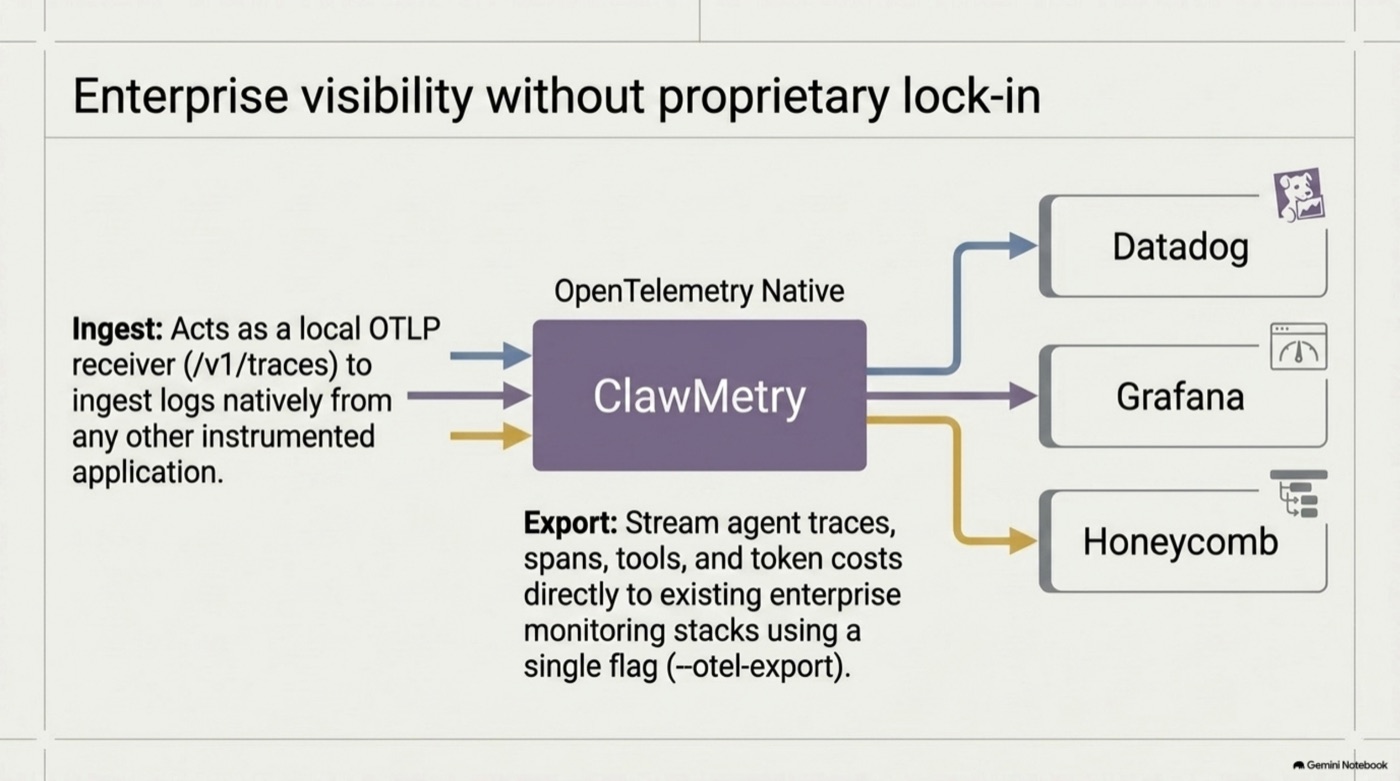
An observability tool that traps your data has just become another problem. ClawMetry speaks OTLP in both directions: it can ingest from anything already instrumented, and it can export agent traces, spans, tools and token costs straight into the monitoring stack you already pay for.
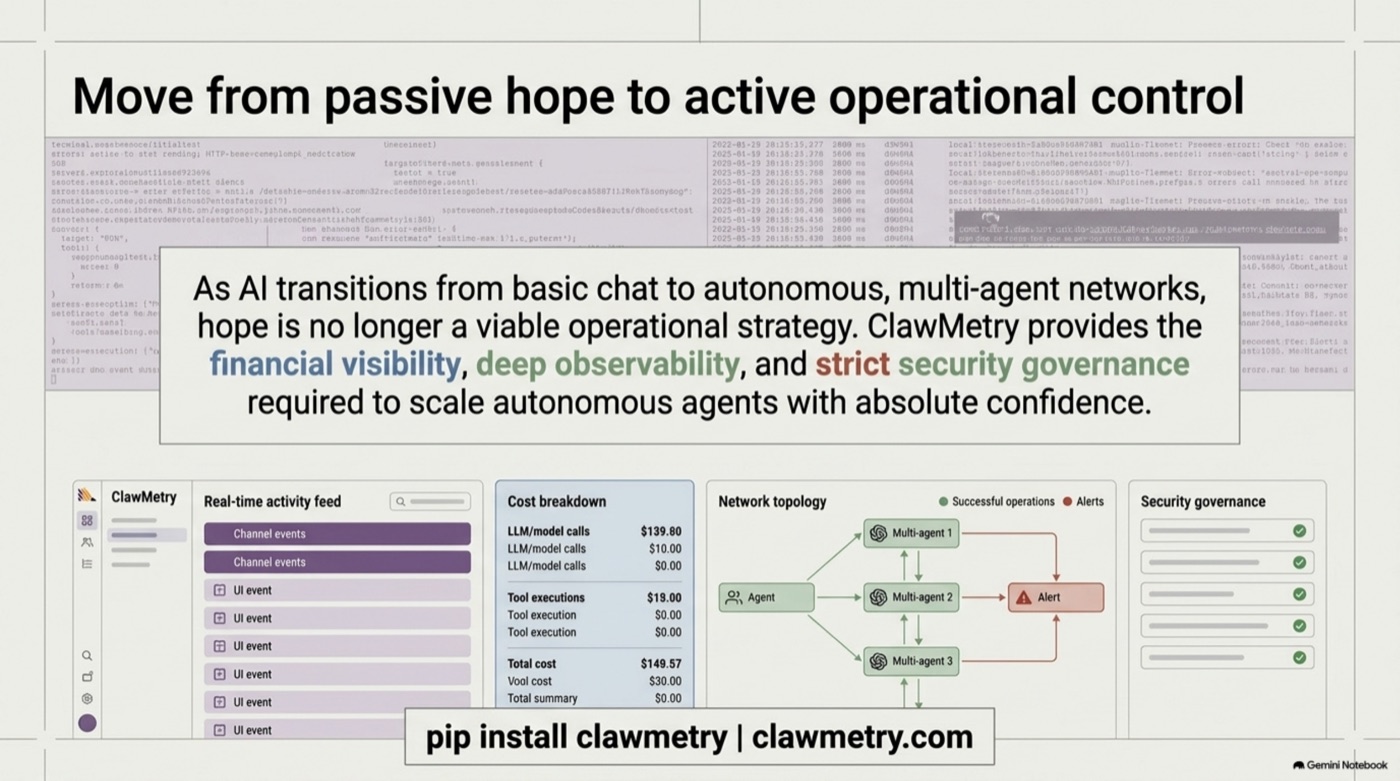
From passive hope to operational control
As teams move from single chat sessions to networks of autonomous agents, “I think my agents are working” stops being a viable operating strategy. The shift is from hoping to knowing: financial visibility, deep observability, and — when you want it — enforcement.
Try it on something you are already running
It is open source and free to run locally. Point it at whatever agent you have going right now.
pip install clawmetry && clawmetry