01 / DISCOVER
What is running here?
Install ClawMetry on a machine. It finds supported agent runtimes and reads their available sessions, sub-agents and tool calls. You do not need an SDK or changes to how the agent runs.
 ClawMetry
THE CONTROL PLANE FOR AI AGENTS
Know what your AI agents are doing, and when to step in. ClawMetry watches their activity, spots risky patterns and notifies you. Add policies to pause runaway work, gate risky tools and cap spend.
pip install clawmetry && clawmetry33 runtimes · No SDK for supported local runtimes · Local-first · Open-source core
Files, commands, tool calls and spend
Checks the action. Connects the pattern.
Slack · PagerDuty
WhatsApp for approvals
Your connected channels
Pause the looping run
Hold for approve or deny
Cap spend via the proxy
You choose when it can act.
Controls are opt-in.
Local memory. Better context.
Learns normal activity. Keeps a record of decisions.
Monitoring follows recorded activity. Controls and notifications depend on runtime, plan and setup. Check coverage
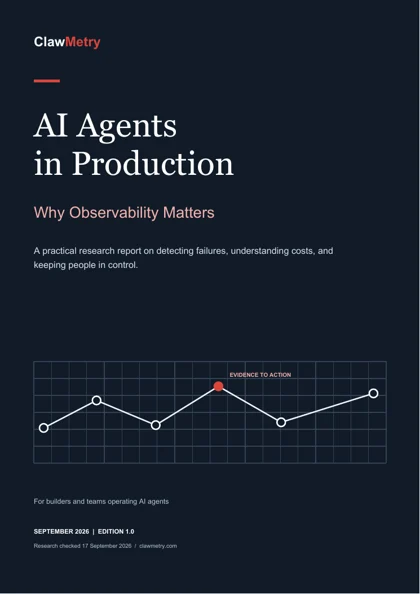
Free research report / September 2026
Why observability matters.
Understand what can go wrong, which signals to watch, and when to step in. A practical guide for teams putting AI agents to work.
17-page PDF in English. Research checked 17 September 2026.
THE FLEET NOBODY PROCURED
Your engineers installed Claude Code, Cursor, Codex and Copilot last quarter. Nobody procured them, and all of them have your repo and your keys.
ENGINEER LAPTOPS
CI / SERVERS
Security · Cost · Audit
No SDK to remember. No new agent framework. ClawMetry reads the session stores supported agents already write, on every machine you install it on, and brings them into one inventory. Rolling it out across a fleet is still a per-machine install today.
ONE MODEL, THREE VERBS
Everything ClawMetry does sits under one of these. Cost is Observe. Loops are Observe. Inventory is Discover. Approvals, budgets and the kill switch are Govern.
01 / DISCOVER
Install ClawMetry on a machine. It finds supported agent runtimes and reads their available sessions, sub-agents and tool calls. You do not need an SDK or changes to how the agent runs.
02 / OBSERVE
Follow the work as it happens, price it where the runtime exposes the data, and catch the sessions that are busy without advancing.
03 / GOVERN
Hold a tool call for approval. Cap routed spend. Pause or stop a run. Keep a record of each decision. Controls are off by default. Your policies decide when ClawMetry can act.
Use supported process controls to pause or terminate an agent. Optional policies can escalate when an incident persists.
Process control coverage ↗Claude Code's opt-in pre-tool hook holds matching actions for approval. A denied call stays blocked. The agent can try another approach.
How approval gates work ↗Use budget alerts for visibility. Route compatible model traffic through the optional proxy to enforce limits before another call.
Explore budget enforcement ↗Pre-tool gating, mid-run control and model-call budget enforcement are different capabilities. Check the matrix for your runtime.
Control works where the runtime permits it, and nowhere else. See exact runtime coverage →
SEE IT WORK
Tool calls
84
Files written
0
The whole signal. Work that costs money and changes nothing.
"claude_code: 84 tool calls, no file changes, not advancing." Stop or Pause this agent from the ClawMetry dashboard or device.
Across 102 sessions in 20 hours on that machine, 14 were flagged by 9 different detectors. They are warnings worth opening, not proven savings.
Verbatim record, not a mockup. A real detection from the laptop ClawMetry was built on. The steps, the counts and the message are what the daemon wrote to disk.
Why ClawMetry exists Every AI agent needs a kill switch. Read the founder's story →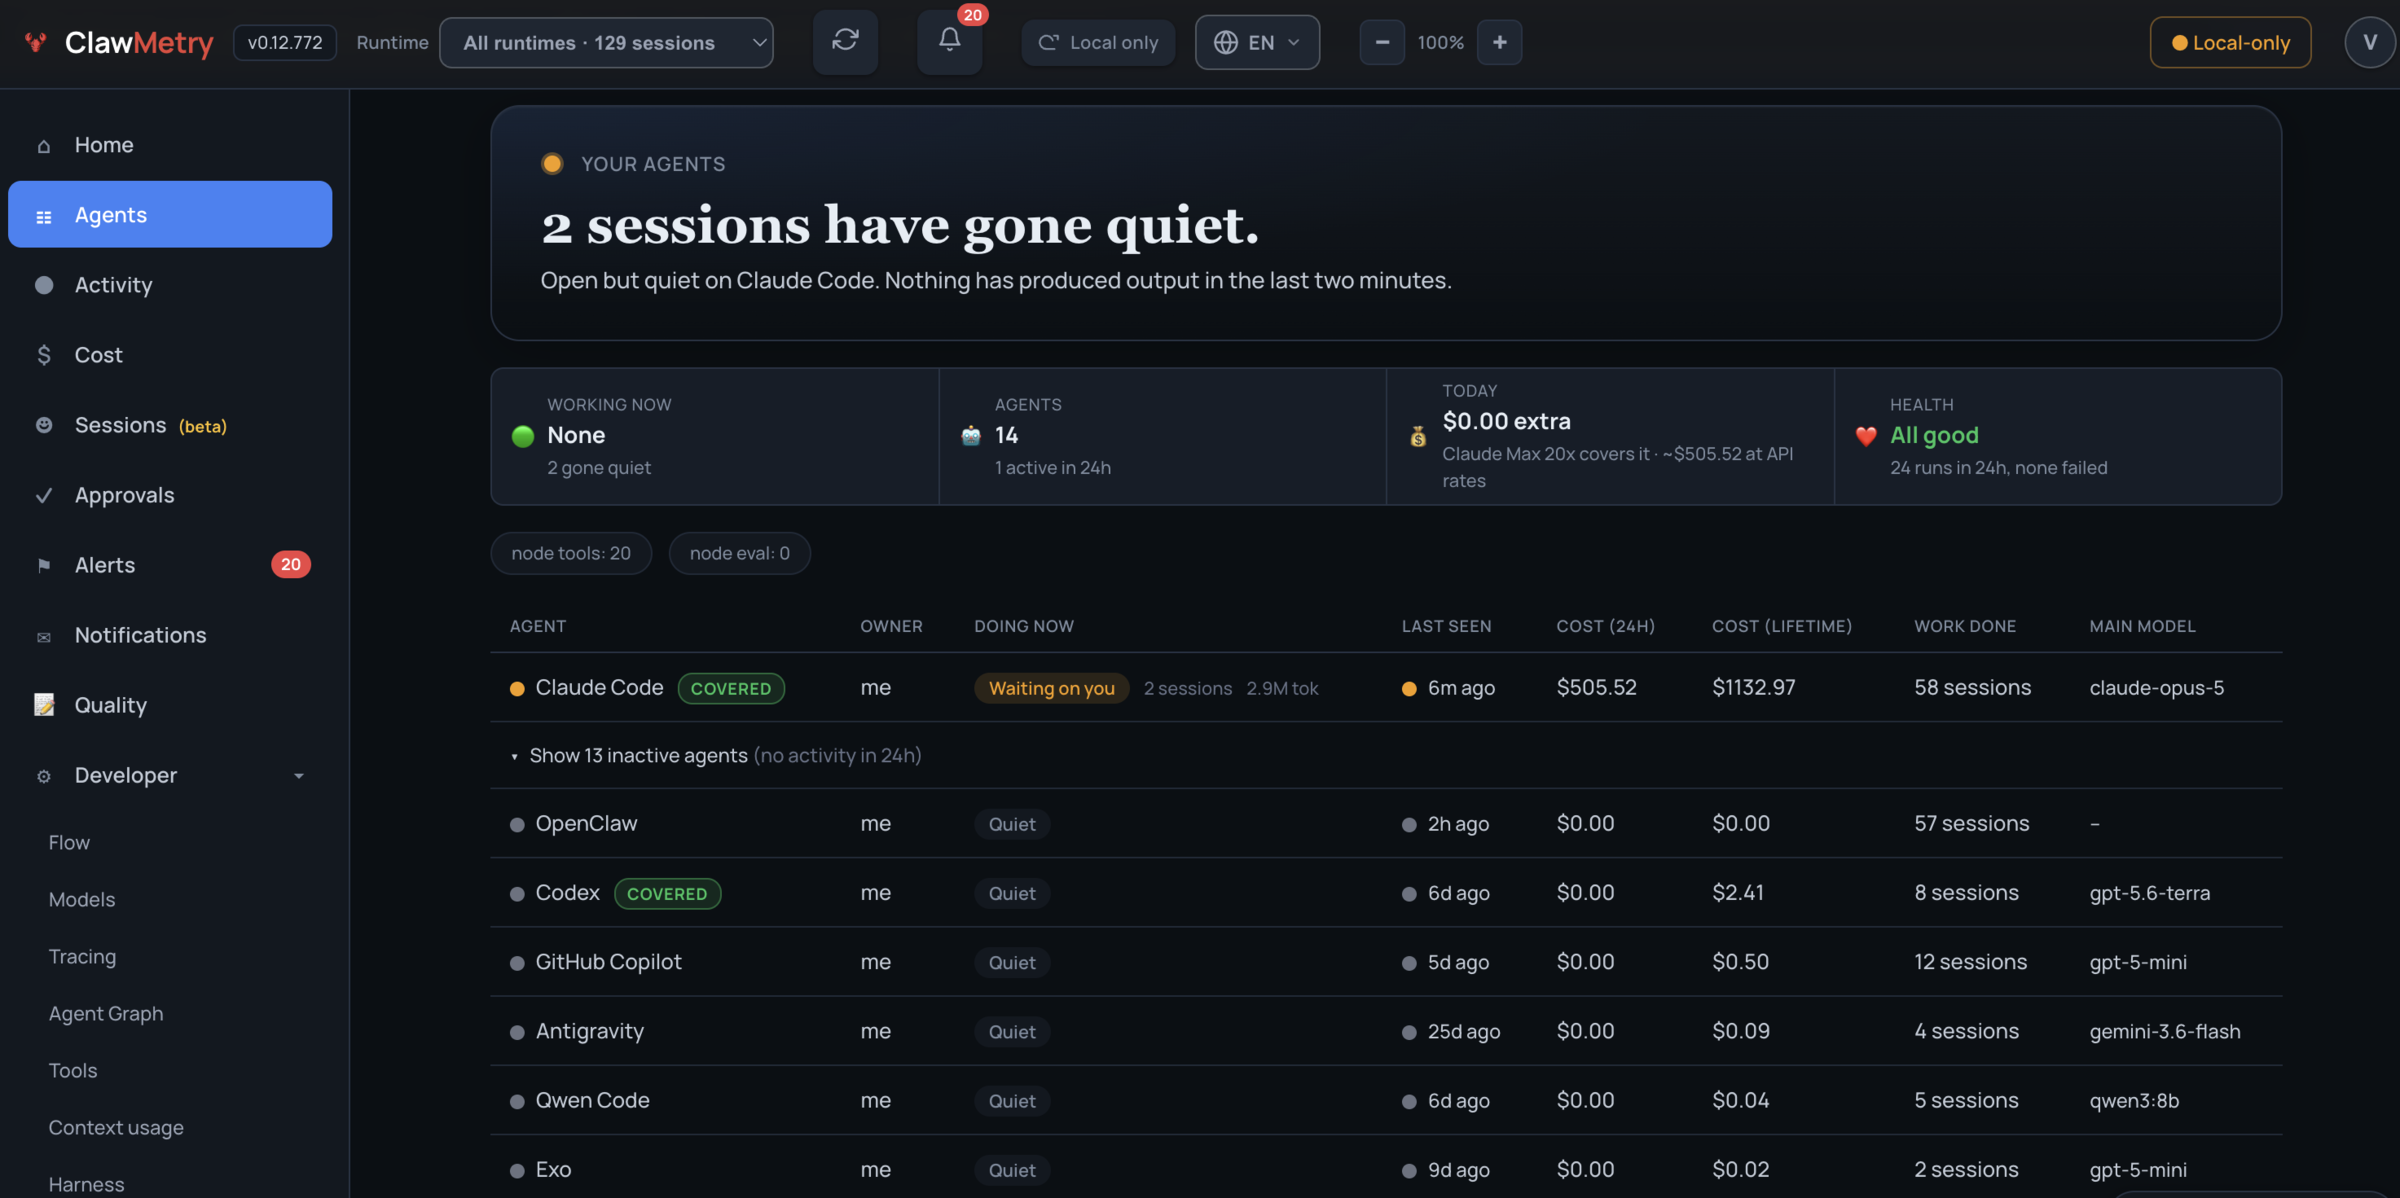
Actual ClawMetry interface, from the public product screenshots. Data shown is from the founder's machine. Source ↗
Session replay, live activity, sub-agent graphs, tool timelines and runtime-specific detail.
Developer views ↗Token and cost attribution, cache analysis, context usage, model routing advice and run comparisons.
Cost optimization ↗Quality scoring, evals, error triage, Self-Evolve findings and visibility into version changes.
Quality and advanced views ↗Health, logs, memory, skills, schedules and channel activity where the runtime exposes them.
Dashboard guide ↗Supported approval gates, incident policies, budget controls, security posture and tamper-evident records.
Governance guide ↗MCP, OpenTelemetry, custom ingest, alert destinations and Enterprise SIEM export.
API and integration guide ↗Availability depends on your plan, runtime and configuration. Consult the linked documentation and pricing.
flagged by a detector
fired over the same window
Measured on the machine this page was written on: 102 sessions in 20 hours on 26 August 2026. These were warning signals, not proven savings.
How these signals are detected ↗ONE CONTROL PLANE, WHATEVER YOUR ENGINEERS USE
Your platform team does not maintain these. We do.
33 runtimes with shipped adapters. Coverage differs per runtime. The picker above says how, for yours.
Controls depend on runtime, OS, configuration and plan. A telemetry integration alone cannot stop an agent.
Read detailed coverage ↗Don't see the harness you use? Tell us and we'll add support in about two days. Leave an email and we'll ping you the moment it ships, plus two months of Pro.
START WITH ONE DEVELOPER. SCALE TO THE FLEET.
Monitor the agents on your own machine. OpenClaw, NVIDIA NemoClaw, Goose and Qwen Code, no account.
Observe and govern every supported runtime across your machines. From $9 per node per month.
SSO, audit export and customer-hosted deployment. Air-gapped networks are validated in a pilot.
See pricing 7-day Pro trial on every runtime. No credit card.
Understand agent spend, investigate risky activity, and evaluate controls across your environment.
START WITH YOUR OWN AGENTS
Install on the machine where your agent runs. Open the dashboard. Find one session worth understanding.
pip install clawmetry && clawmetryRequires Python and a supported agent runtime on this machine.
Then open localhost:8900 ↗
Start free on one machine, without an account.
Claude Code, Codex, Cursor or another paid runtime?Start the 7-day Pro trial ↗ · No credit card.
Then choose the plan that fits. See pricing →
BEFORE YOU INSTALL
No. Observation reads the session stores your agents already write. It needs no SDK and no change to your code. Enforcement is separate and opt-in: pre-tool hooks, proxy routing and process controls each require setup. What runs on your machine, and what leaves it →
No, and the matrix says exactly where it can. Claude Code exposes a pre-execution tool hook. Mid-run control needs a reachable, correctly identified process. A Cursor editor conversation shares the one IDE process, so a per-session kill is unsafe and we refuse it. Exact runtime coverage →
Not until you turn something on. Session data stays local until you enable cloud sync or an export. A default install still makes install and update requests. Cloud sync encrypts session content on the node, while operational metadata stays readable by the service. Read the full data inventory →
COMMUNITY









New runtimes, new controls, and what we learn running agents on our own machines. No more than twice a month.