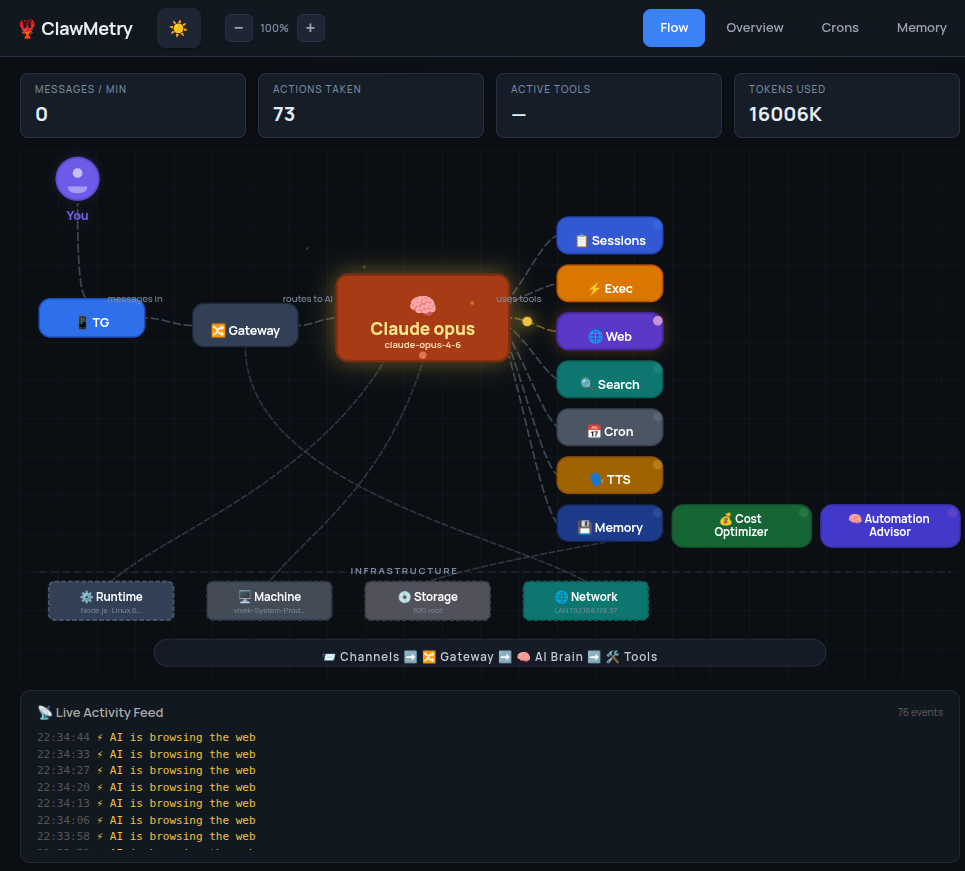
NemoClaw × ClawMetry
Real-time observability for NVIDIA NemoClaw

Know what's happening inside your
NemoClaw sandboxes.

NemoClaw gives you a terminal. ClawMetry gives you structured, persistent observability: every tool call, every token, every sandbox state, synced to the cloud. E2E encrypted.

🔐 E2E encrypted ⚡ All instances covered 🖥 Whole fleet in one view

Runs on host · Applies to all instances · E2E encrypted

How it works

Three steps to full observability inside your NemoClaw environment.

01

Run on the host machine

One command on the host running NemoClaw. ClawMetry applies a network policy preset to every sandbox automatically, then starts syncing to the cloud.

curl -fsSL https://clawmetry.com/install.sh | bash
02

E2E encrypted cloud sync

An encryption key is generated on your host. Only the encrypted telemetry stream reaches ClawMetry Cloud — prompts, responses, and API keys never leave your machine.

clawmetry onboard
03

Watch from any browser

Open app.clawmetry.com. See live agent sessions, token spend per call, memory file diffs, and cron job status — all in real time from your phone or laptop.

app.clawmetry.com

Quick Start

Run on the host machine to cover all your NemoClaw instances at once.

# Run on the host machine running NemoClaw
$ curl -fsSL https://clawmetry.com/install.sh | bash

Works inside any NemoClaw environment · Python 3.8+

🙋
Need help setting up?
Drop your email and we'll help you get ClawMetry running on your NemoClaw fleet.

Built for NeMo environments

Everything you need to understand what your agents are doing at runtime.

🔐

E2E Encrypted

All data is encrypted before leaving your NemoClaw sandbox. Keys never leave your machine. We see nothing.

📊

Live Agent Activity

See every tool call, token spend, and sub-agent spawn in real time. No more guessing what your agents are doing.

🌐

Access from Anywhere

Web dashboard at app.clawmetry.com. Works from any browser, any device. Mobile coming soon.

🧠

Memory Monitoring

Watch SOUL.md and MEMORY.md for unexpected changes. Know when your agent's memory gets corrupted before it causes real damage.

💰

Token Cost Tracking

See exactly what each session costs. Per-call breakdown, daily totals, monthly projections. No more bill surprises.

🔄

Cron Job Monitoring

All scheduled tasks visible in one place. See last run, next run, and failures — without reading logs or SSHing in.

🛡

Works with OpenShell guardrails

ClawMetry observability runs alongside NemoClaw's security layer, not against it. See agent activity without bypassing any sandbox policy.


Beyond the TUI. Built for production.

NemoClaw's built-in TUI is ephemeral and terminal-only. ClawMetry adds what production requires: structured logs, persistent history, cloud access, and a governance layer for fleet-scale deployments.

LIVE
Fleet observability
Every NemoClaw sandbox visible in one cloud dashboard. Structured, persistent logs — not ephemeral terminal output. Live sessions, token costs, memory and cron jobs across your entire fleet.
SOON
Policy visibility + drift detection
See which OpenShell policies are active on each node. Get alerted when a policy changes unexpectedly — before it becomes a security incident.
SOON
Remote approvals
NemoClaw's egress approval requests surface in ClawMetry Cloud. Approve or deny network access from your phone — no SSH, no terminal.
FUTURE
Remote policy management
Push policy updates to all sandboxes from ClawMetry Cloud. Manage your entire NemoClaw fleet's security posture from one interface.
View full roadmap →

See your agents think

Real-time observability for every tool call, token cost, and memory operation across your NemoClaw fleet.

ClawMetry dashboard

Your entire NemoClaw fleet.
One dashboard.

Run one command on the host. Every NemoClaw node shows up in ClawMetry Cloud instantly.

curl -fsSL https://clawmetry.com/install.sh | bash

Open Dashboard →

Host install · All instances · E2E encrypted