 Claw
Claw
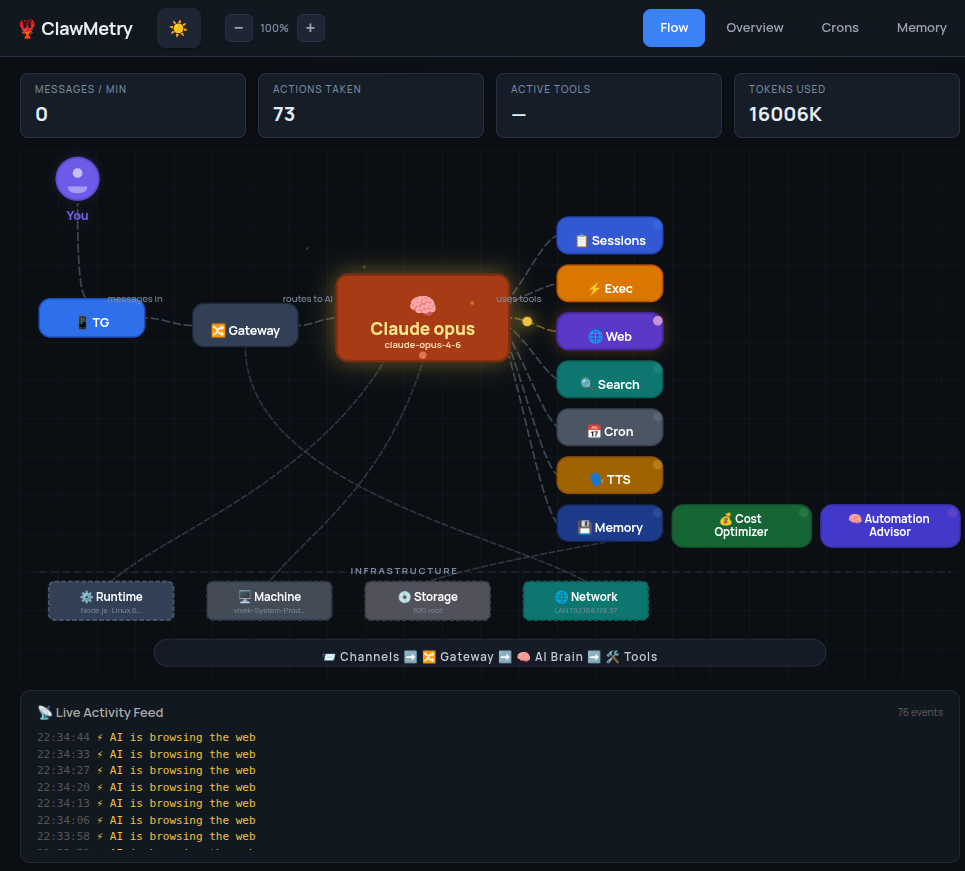
Three Agent Fires ClawMetry Would Have Caught
I've been watching a pattern emerge in the forums this year. Someone ships an agent, it works fine in testing, it runs unsupervised overnight, and in the morning, something has gone badly wrong. Not a crash. Crashes are easy. These are the subtler failures: the ones that cost money before you even notice, that look like success from the outside, that leave no stack trace.
Three patterns keep showing up. I want to walk through each one concretely: what the developer saw (and didn't see), what actually happened, and what ClawMetry would have surfaced in real time.
Attribution note: The incidents below are synthesized from real developer reports on HN, Reddit, and TechCrunch from the past 30 days. I've paraphrased to protect privacy and combined similar reports. Links to source material appear throughout.
Incident 1: The Overnight Token Bill
“I woke up to a $6,000 bill and my agent had been looping since midnight.”
An autonomous refactoring agent hit a rate limit, received a human-readable error as exit code 0, and its wrapper script retried in a loop for 7 hours.
This is the most common one. A developer sets up an agent to do a long overnight task: refactoring a large codebase, processing a backlog of data, running a batch of API calls. They go to sleep. In the morning, their API bill is up by thousands of dollars and the task either completed ten times over or didn't complete at all.
The root cause, reported repeatedly across HN and developer communities, is subtle: when Claude Code hits a rate limit, it returns "You've hit your limit" as normal text output with exit code 0. Exit code 0 means success. So any wrapper script watching for failures sees nothing wrong and retries. Each retry costs tokens. One developer reported that 96% of their API spend over a long weekend was rate limit retries, not actual work being done. The agent appeared to be running normally the entire time.
Source: TechCrunch, June 5 2026; reported pattern from developer community
The terrifying part in several accounts: all the monitoring dashboards were green. The process was running, the API was responding, the exit codes were 0. Nothing looked wrong. There was just a bill at the end.
What ClawMetry surfaces
- The token cost meter on
/api/usageticks upward in real time; you'd see the hourly rate accelerating past any reasonable baseline within the first 20 minutes. - The session view shows the tool call that returned the rate-limit message, and every subsequent retry as a new call; so instead of one session doing 10 steps, you see one session doing 600 identical steps.
- Budget alerts (Cloud Pro) fire as soon as the hourly spend exceeds your configured threshold. The alert includes the session ID and the tool call that started the spiral.
- The sub-agent tracker shows the parent session still active after any reasonable expected completion time, flagged in amber.
The fix, once you see it, is trivial: parse the model's response for rate-limit language and treat it as a real error. But you can't do that if you don't know it's happening. With ClawMetry running, you'd see the loop forming within one rotation, and you'd have a phone notification before the third retry.

Incident 2: The Silent Hang
“The terminal looked frozen. The agent appeared to be thinking. It had been waiting for keyboard input for four hours.”
An agent spawned a subprocess that required interactive confirmation. The subprocess waited. The agent waited. Nothing errored out. Four hours of compute, zero output.
This one is particularly insidious because it looks, from every external angle, like the agent is working hard. The process is alive. The CPU is occasionally active. API calls continue going out. You see activity in the gateway WebSocket. But the agent is deadlocked waiting for a keyboard input it will never receive.
The scenario: an agent running a deployment script hits a step that prompts Do you want to continue? [y/N]. In a terminal you'd press y. But the agent is running non-interactively; no one is there to type. So the subprocess stalls at the prompt, the agent is blocked waiting for the subprocess to complete, and both sit there consuming nothing except time and context tokens.
Source: OpenHelm Blog, 2026; pattern confirmed in dev community reports
What makes this hard to catch without purpose-built tooling: the agent isn't looping (so cost stays flat), the process isn't crashed (so process monitors stay green), and the gateway connection is still alive (so WebSocket health checks pass). The only signal is absence of output for longer than expected.
What ClawMetry surfaces
- The session timeline on
/api/sessionsshows the last tool call timestamp. When a session has been running for 45+ minutes since its last tool event, it turns amber (stalled, not completed). - The brain stream (
/api/brain-stream) goes quiet. In a healthy session you see reasoning events every few minutes. A silent stream for an hour is a signal, not background noise. - The flow panel shows the subprocess call that started the hang; you can see exactly which tool call entered the blocked state and when.
- Session duration in the sub-agent tracker keeps climbing with no new tool events; the ratio of elapsed time to tool output becomes anomalous.
We didn't design ClawMetry specifically to catch interactive-input deadlocks. But when you have per-session event timelines and a live event stream, these hangs become visible as negative space: a session that's still “active” but produced no events in 90 minutes is unmistakably broken. You don't need a hang detector. You need a timeline.
Incident 3: The Confident Wrong Answer
“The tool call returned 200. The agent spent 40 minutes reasoning from the wrong data. We had no idea until a human noticed the output made no sense.”
An external API returned a stale cached response with an HTTP 200. The agent had no way to know it was wrong, built a plan on top of it, and executed that plan completely.
This is the most dangerous pattern because it produces no error signal at all. Traditional APM tells you that an API call returned 200. What it doesn't tell you is that the 200 response contained a stale cache hit, a soft error wrapped in success semantics, or data from the wrong tenant. The agent proceeds confidently, building reasoning on top of a rotten foundation.
One pattern reported in the observability community: an agent queried a pricing API that returned cached data from 6 hours prior. The API returned 200 with a valid JSON body. The agent used those prices to generate a proposal, ran several follow-on tool calls to validate and format it, and produced a finished output. The prices were wrong by 12%. No health check would have caught this because the failure mode, as described by a Laminar engineer, is one that “looks like success.”
Source: Laminar.sh, April 2026; pattern reported across developer observability discussions
The broader framing: when a deterministic service breaks, you get a stack trace. When an AI agent reasons from bad data, you get a clean, confident, expensive output. No crash, no alert, no 500. Just a wrong answer delivered with certainty.
What ClawMetry surfaces
- The transcript viewer in
/api/transcript/<id>shows the full tool call chain including the exact response body the model received. You can see what the agent was given, not just that the API returned 200. - The tool timeline lets you replay the session step by step. Every tool response is stored; you can inspect what the pricing API returned at the exact call that kicked off the bad reasoning chain.
- Session cost attribution shows the downstream cost of every branch of reasoning. If 40 minutes of compute descended from a single tool call, you see that in the tree.
I want to be honest about what ClawMetry does and doesn't do here. We can't tell you the API gave the agent wrong data; we don't know the ground truth for your external dependencies. What we can do is give you the full tool call response, verbatim, at the exact step where the reasoning went wrong. That means a human reviewer can spot the problem in seconds rather than having to manually reconstruct the session from scattered API logs. The forensics go from hours to a single transcript view.
The common thread
Look at these three incidents side by side. In each one, the traditional monitoring stack reported nominal health:
- Incident 1: Process running, exit code 0, API responding normally. Green dashboards.
- Incident 2: Process alive, WebSocket connected, no errors. Green dashboards.
- Incident 3: HTTP 200, valid JSON, no exceptions thrown. Green dashboards.
Traditional APM is designed for deterministic systems. A service either returns a correct response or it throws. Agents don't throw when they fail; they continue, confidently, in the wrong direction. The signal you need isn't in the status code; it's in the event stream, the token trajectory, the tool call timeline, the ratio of elapsed time to useful work.
This is what I mean when I say agent observability is a different problem. It's not harder, but it's different. You need visibility into the interior of the agent's reasoning loop, not just its exterior behavior.
The industry is starting to catch up. Specialized platforms built specifically for agent tracing (multi-turn step-level traces, tool call attribution, causal chain debugging) are now the default recommendation for teams running agents in production. The 2026 pattern is purpose-built agent observability, not extending existing APM. That's the space we've been building in since day one.
What we built for each of these
None of these incidents surprised us. We'd seen the patterns early, in our own OpenClaw setup first, then in user reports as ClawMetry reached 120K+ installs. Here's what we ship specifically for each:
For cost runaway
Budget alerts in ClawMetry Cloud Pro let you set a per-session and per-day spend cap. The alert fires before you hit the cap, with enough context to act: which session, which model, the current burn rate, and a link to the tool call that started the spiral. The alert goes to Slack or PagerDuty, not just the dashboard.
For silent hangs
The brain stream is the heartbeat. A healthy session produces reasoning events. When a session is active but the event stream goes dark for more than a configurable threshold, we surface it as a stalled session: a distinct state from running, failed, or completed. You see it immediately in the session list.
For bad-data reasoning chains
The transcript viewer is non-negotiable for post-incident analysis. Every tool call request and response is stored verbatim. When something goes wrong and you need to know what the agent was given at step 7 of 23, you open the transcript and scroll to step 7. There's no reconstruction from scattered logs; the whole session is there in sequence.
All three are part of the local-first DuckDB store that ships in the open-source core. The budget alerts and Slack/PagerDuty integrations are Cloud Pro. The transcript and event stream work offline, on your own hardware, with zero data leaving your machine.
The honest part
There are failure modes ClawMetry doesn't catch. If your agent produces plausible-looking output that's subtly wrong at the content level, we can't flag that; we don't know what correct looks like for your domain. If a model regression makes your agent's reasoning worse without any change in token usage or timing patterns, we might not notice. We're an observability layer, not an evaluator.
But the three incidents above? We catch those. Not because we built specific detectors for each, but because when you have a complete, real-time view of session cost, event timing, and tool call content, these failures stop being invisible. They become visible as exactly what they are: a cost curve that turns vertical, an event stream that goes quiet, a tool response that contains the wrong data.
That's the thing about agent observability. The failures aren't mysterious. They're just hidden, until you have the right lens.
Stop flying blind on your agents
Open source. Local-first DuckDB. Zero config. E2E encrypted cloud sync optional.
Get ClawMetry: pip install clawmetry